
Validation results for the MODIS 10 Km product are using data from collection 6.1. Validation results for the MODIS 3 Km product are using data from collection 6.
Validation results for the VIIRS DT product are for version 1.
MODIS 10 Km Product
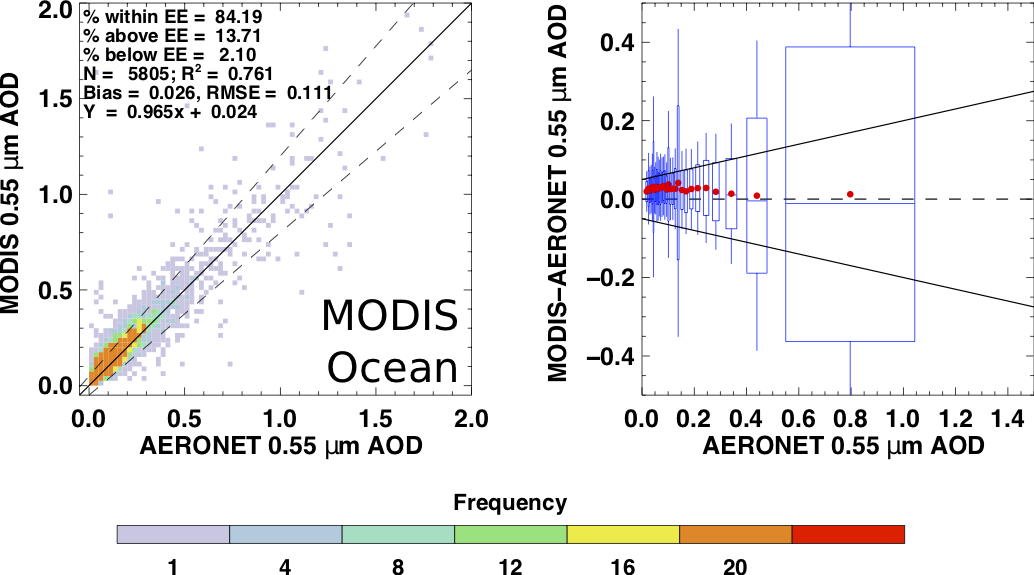
For all 10 Km products the Expected Error envelope is defined using the Equation EE = +/- (.05 + 15% * AOD). See the graphs below for the scatter plot including the EE envelope.
Ocean validation is for QA 1, 2 and 3. Land validation is QA 3 only. Note that the data in the tables is for the entire data set. The scatter plots below for MODIS and VIIRS are for 2015 only.
| Ocean | Land | |
| Aqua |
Percent within EE = 83.80% Percent above EE = 13.57% Percent below EE = 2.63% N = 58993; R = 0.874 Bias = 0.023 RMSE = 0.096 Y = 0.975x + 0.021 |
Percent within EE = 76.15% Percent above EE = 15.75% Percent below EE = 8.09% N = 176592; R = 0.919 Bias = 0.013 RMSE = 0.100 Y = 1.055x - 0.003 |
| Terra |
Percent within EE = 77.41% Percent above EE = 20.92% Percent below EE = 1.67% N = 61898; R = 0.895 Bias = 0.039 RMSE = 0.099 Y = 1.055x + 0.023 |
Percent within EE = 73.38% Percent above EE = 21.13% Percent below EE = 5.49% N = 209491; R = 0.920 Bias = 0.029 RMSE = 0.106 Y = 1.050x + 0.014 |
Table 1. Statistics of MODIS Collection 6.1 10 Km product validation for the full time series of MODIS data. The ocean validation does not include data from AERONET Maritime Network Aerosol observations.
Validation Plots for MODIS and VIIRS DT Products
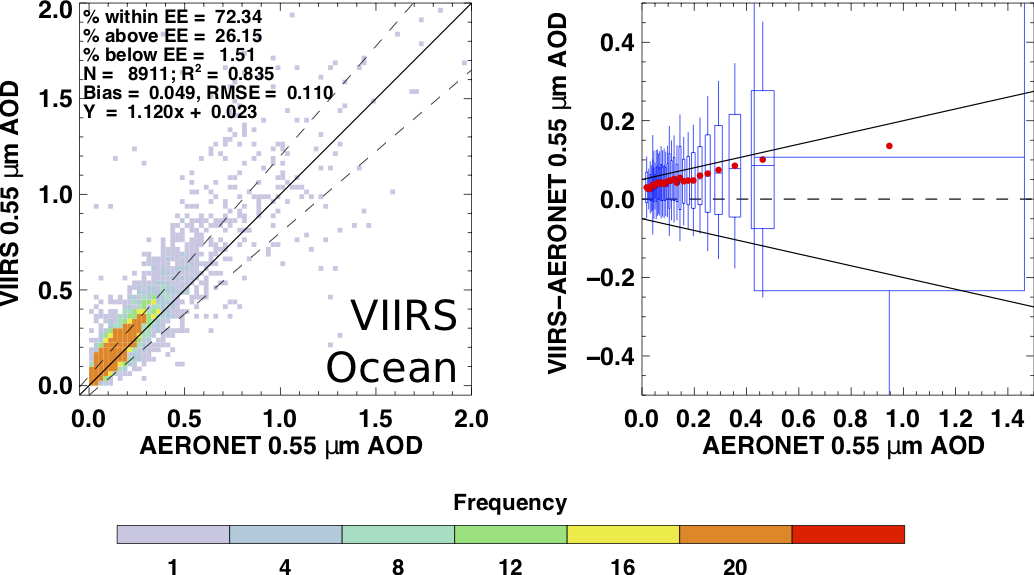
The plots below are created using data from 2015 only.
 |
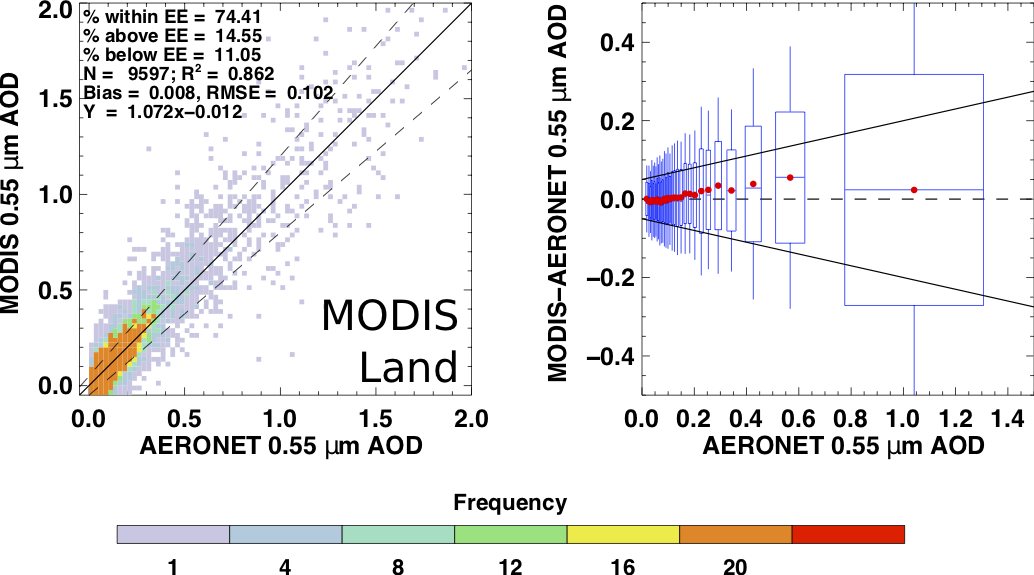 |
| MODIS Ocean Validtaion Data Set C61 | MODIS Land Validation Data Set C61 |
 |
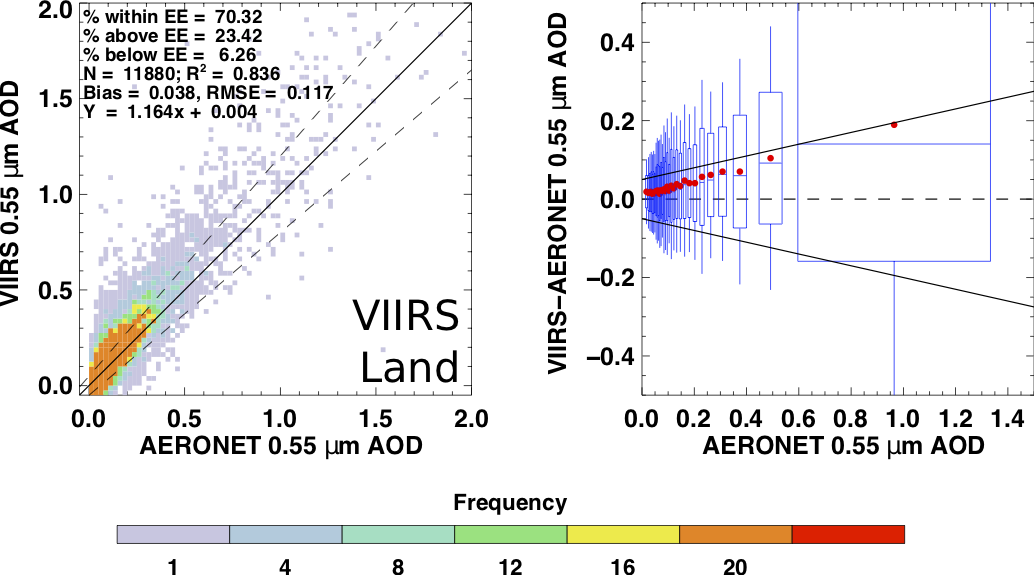 |
| VIIRS Ocean Validation Data Set | VIIRS Land Validation Data Set |
Figure 1. Scatter and box plots for the MODIS 10 Km and VIIRS 6 Km products for 2015. For instructions on how to understand the box plots please look here.
MODIS 3 km Product
For all 3 Km products the Expected Error envelope is defined using the Equation EE = +/- (.05 + 20% * AOD).
Only highest level quality (QA 3) is included in this analysis.
Data and plots below are from Gupta, P. et. al. This paper also includes detailed regional validation of the product which is not shown below.
| Aqua |
Percent within EE = 68.36% Percent above EE = 21.47% Percent below EE = 10.18% N = 71248; R = 0.87 Bias = 0.027 RMSE = 0.13 |
| Terra |
Percent within EE = 62.47% Percent above EE = 31.33% Percent below EE = 6.2% N = 90162; R = 0.87 Bias = 0.059 RMSE = 0.15 |
Table 2. Statistics for MODIS 3 KM Collection 6 Product Combined Land and Ocean.
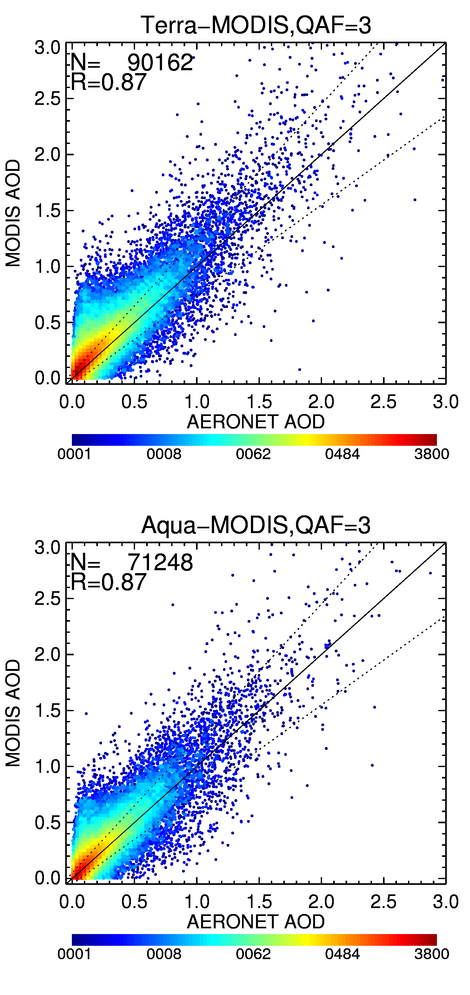
Figure 2. Two-dimensional density scatterplot of MODIS 3 km AOD versus AERONET observed AOD at 0.55um
for the global colocation data set. Top plot is for Terra MODIS for highest quality data (QA 3 only).
Bottom plot is for Aqua MODIS only for QA 3. The solid line is the 1:1 line. The dashed lines denote the Expected Error envelope.