
Validation Maps and Plots for Individual Sites
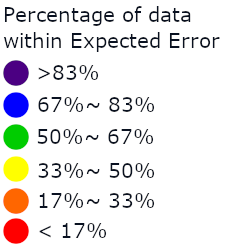
The maps on this page can be used to view the results of comparisons at each AERONET site used in our validation data set. Each colored dot on the map shows the approximate location for a site. The color of the dot indicates the overall performance of a site as far as the percentage of points within the expected error envelope. A higher percentage indicates a better performance of the retrieval algorithm at that particular location.
Clicking on one of the sites on the map will open a window showing two plots of the data and some text describing the statistics of the comparison between MODIS and AERONET. Clicking on the image with the plots will open a larger image of the plots. Clicking again on the enlarged plots will close that image. To hide the image with the plots and data click on the map.
Explanation of the Plots:
Scatter plot: The left-hand plot is a scatter plot of MODIS AOD vs Aeronet AOD. The colors of the points on this graph indicate the months the data was collected. The solid line is the 1 - 1 correspondence line. The dotted lines delineate the expected error envelope.
Box plot: The right-hand plot provides additional statistical analysis of the data. The data is binned according to AERONET values using the following AOD bin endpoints: 0,.025, .05, .075, .1,.15,.2,.25,.3,.4,.5,.6,.75,1,1.25,1.5
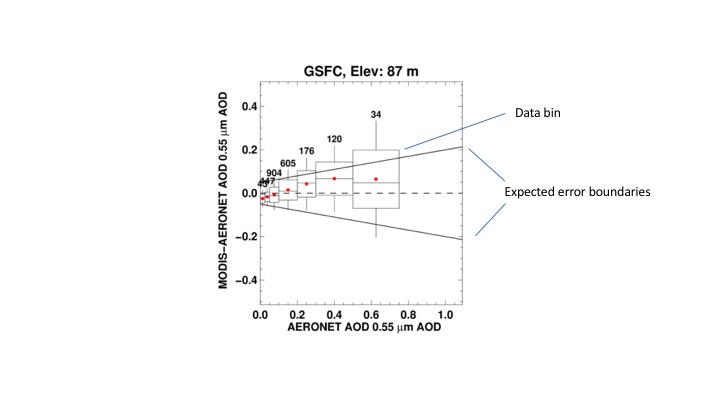
In the sample box plot at left each bin is shown as a box. The y-axis shows the difference between the MODIS retrieved value and the AERONET measurement. The x-axis is the AERONET value.
The dotted line across the center of the plot is the one-to-one measurement line. The solid lines show the expected error envelope.
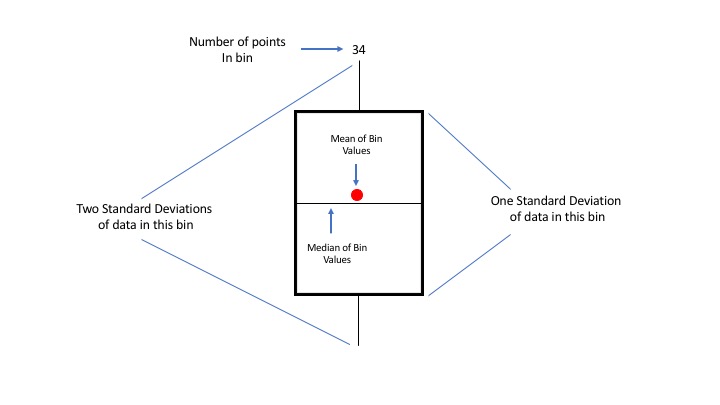
The center line of each box shows the median satellite retrieval value for that bin whereas the red dot shows the mean.
The number at the top of the box is the number of points in the bin.
The vertical lines at the top and bottom of the box show the range of 2 standard deviations.
The upper and lower margins of the box show the range of 1 standard deviation of the satellite retrieval.
The right and left sides of the box show the boundaries of the bin.